It has been an increasingly difficult task for Google to quantify the quality of a website’s user experience, leading to the creation and development of tools to measure every facet of user experience. Tools often used to measure user experience on a website include PageSpeed Insights, Lighthouse, and the Google Search Console. In a move to make it easier for webmasters to monitor and improve their user experiences, Google unveiled the “Core Web Vitals” report on 5th May, 2020 in the Google Search Console. The report draws its data from the Web Vital engine, simplifying the web experience landscape into three homogeneous metrics. Google refers to them as “the three most important metrics for all web experiences”. The update is intended to make it easier for webmasters and site owners to make improvements to their websites without having to hire performance gurus or go through numerous complex analytics reports. It is also aimed at helping Google in ranking websites for their UX in searches.
What are Core Web Vitals?
The three Core Web Vitals represent the three distinct phases of the user experience: the loading experience, site interactivity, and the visual stability of the page contents of a website. The three are designed to be quantifiable and consistent improvements to these metrics that ultimately improve the ‘real-world’ user experience. Using Google’s Search console, you can analyze a website to see how many of the URLs rank ‘poor’, ‘Need Improvement’, or ‘Good’. This makes the analytics simple enough for novice webmasters and website owners to understand the performance report.
Which metrics are measured in Core Web Vitals?
According to Google, the three metrics discussed below are used as Core Web Vitals. However, Google has also stated that these metrics are bound to evolve over time, and hence, it is important to keep up to date with the latest metrics from Google. The three metrics are;
Largest Contentful Pain (LCP)
Cumulative Layout Shift (CLS)
First Input Delay (FID)
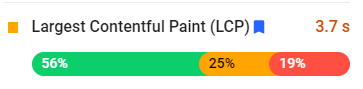
Largest Contentful Paint (LCP)
The first metric analyzed in the vitals of any website online, LCP measures loading performance; the average time it takes to load the largest element of page content onto the viewport. The element’s size is primarily determined by its visible size to the user in the viewport. Any content outside the user’s viewport, whether clipped or invisible, will not count in quantifying the element’s size. Additionally, only specific element categories are considered as part of the LCP:
Image elements
Elements with background images that are loaded via the URL function instead of the CSS gradient
Image elements inside an SVG element
Video elements
Block-level elements containing text nodes or any other inline-level elements
Since the largest element on a page can change while the page loads, Google considers the newest, largest element until the page loads fully or the user starts interacting with the contents of the page.
First Input Delay (FID)
FID is a metric that measures a website’s interactivity. It measures the time it takes the browser to respond to a click on a button, link, or a JavaScript-powered control by the user. However, sometimes the main thread is busy and unable to respond to the user’s commands. This is referred to as an input latency, which is often caused by the user’s browser being too busy operating heavy JavaScript files. When the browser is in input latency, a delay occurs between input and action. First Input delay is designed to focus solely on the events commanded by the user such as taps, clicks, and button presses instead of on-page interfaces like zooming and scrolling.
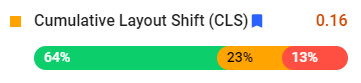
Cumulative Layout Shift (CLS)
Have you ever been a click away from selecting an image, video or link on a page and it suddenly jolts, updates, or moves and you are suddenly in the AppStore? That move/jolt is caused by cumulative layout shift or in layman’s terms; how much a page shifts as it loads. Google strongly intends to prevent CLS. The browser measures CLS by assessing two separate frames for their viewport sizes against the movement of unstable elements on the viewports. The result is a product of the distance function and the impact function. Basically, Google will be able to tell when elements on a page move too far and rank them lower on their search results pages.
What Tools Can You Use to Optimize for Core Web Vitals?
Since the three Core Web Vitals are an integral player in Page Experience update, Google incorporates the metrics in the tools that are commonly used to optimize pages by webmasters and SEOs. Since we all need to measure the success of our sites’ Core Web Vitals, it is only right to get the right tools for the job.
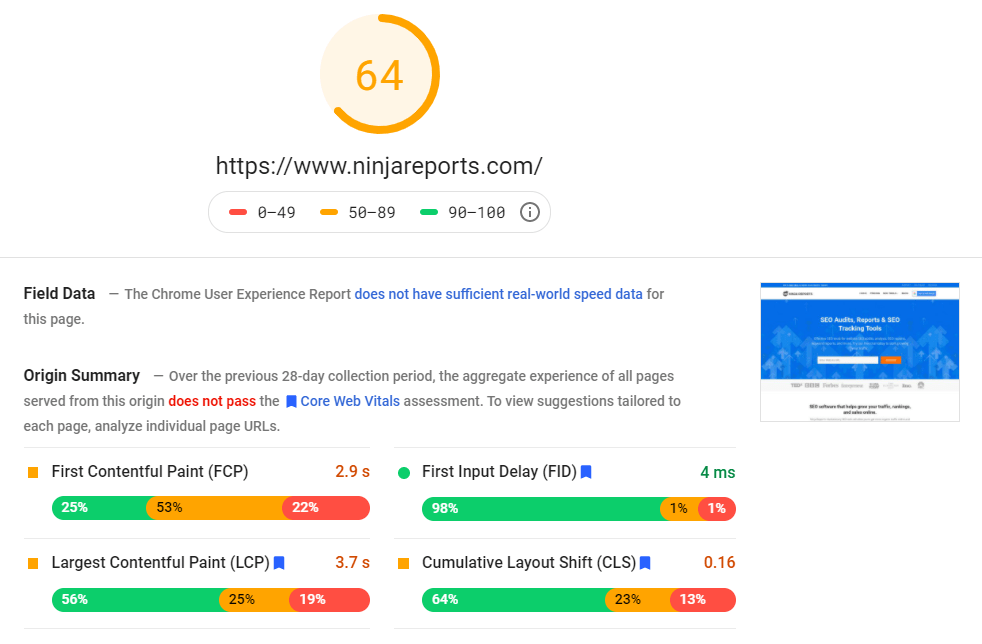
Ninja Reports
Use Ninja Reports to see how to improve your web core vitals. Each Ninja Reports SEO Analysis report includes a web core vitals test and Google Lighthouse test.
PageSpeed Insights
Google’s PageSpeed Insights is one of the most used tools to measure page speed. Apart from allowing the webmaster to view their page’s score, they also include Core Web Vitals metrics that are helpful to the user since they offer them insight into how good the page is. PageSpeed Insights is an excellent tool for measuring the success of SEO efforts. However, it is not the best option if you intend to optimize your site for the Core Web Vitals since there are a lot of details missing in the tool. For instance, to check the pages that need improvements on specific core web vitals, you will have to head back to the Google Search console.
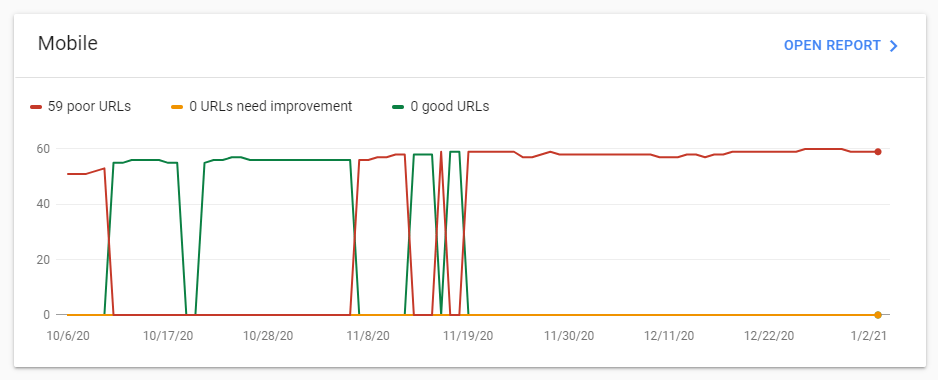
Google Search Console
When looking to check a particular page for its web core vitals, simply log into your website’s Google Search Console and select the Core Web Vitals button on the console’s side bar and a report will appear. If you want to check the report, click on “Type” and the Google Search Console will show you the pages that are currently performing “Poorly”, “Needing Improvement”, or “Good”. After identifying the pages that need optimization for Google’s Core Web Vitals, you can now proceed to use PageSpeed Insights to view suggestions on how to optimize these specific pages.
Chrome User Experience Report
This Chrome User Experience Report provides real-world metrics of how chrome users perceive websites. The metrics are driven primarily by real data. The report compares the experience of actual users of a website to local or virtual tests in simulated and defined environments. With this comparison, you will be able to see clearly the set of variables that form and lead to a good user experience.
Chrome Dev Tools
Chrome Dev Tools is a suite of website development tools that are incorporated into Google Chrome. With these tools, you are able to quickly edit on-the-fly web pages and fix errors to create quality websites faster. Additionally, Chrome Dev Tools allows the site owner or the webmaster to find and solve issues concerning visual instability on a web page, which can cause Cumulative Layout Shift (CLS).
Web Vitals Extension
The Core Web Vitals metrics are also available to webmasters and site owners in a new extension. Providing real-time feedback on all three core web vitals, this extension is consistent with Chrome tests and reports using the metrics on Google’s and other tools. It will not only help the webmaster diagnose their web pages on the go, but also help in measuring the performance of a competitor’s pages that you want to match or beat. You can save time, adapt to market situations faster, and become more efficient with your commands using the Web Vitals Extension.
How to Analyze Desktop and Mobile Web Vital Scores
You can access independent analysis on the Web Vitals between desktop /laptop devices and mobile devices. In some of the tools discussed above, you can run a test or query on a specific device category, and when both are available on the same tool (such as Google PageSpeed Insights), you can easily switch between them. The default setting for PageSpeed Insights is mobile stats, and you will have to switch to the desktop tab to see the difference between both device categories on your pages. The Google Search console now features Core Web Vitals metrics when the Chrome User Experience data is available. When accessing Core Web Vitals, both device categories are displayed on the Google Console dashboard. From here, you can view the groups of pages that are experiencing problems. To view desktop and mobile Web Vital Scores on the new Chrome User Experience Report (CrUX), you will need to configure ‘desktop’ or ‘phone’ as the device form factors in the SQL statements.
What Score is good in Core Web Vitals?
Other than the three-step rating (‘Poor’, ‘Needs Improvement’, and ‘Good’), Google further defines each rating with an agreed threshold to aid the progression of webmasters. The following thresholds determine each vital:
Largest Contentful Paint (LCP): For a good user experience, LCP should occur in 2.5 seconds of the page loading.
First Input Delay (FID): Pages should score less than 100 milliseconds FID for a good user experience on a page.
Cumulative Layout Shift (CLS): For a good user experience, pages should maintain less than 0.1 CLS.
To ensure that your pages are hitting the recommended scores, Google advises that you measure the 75 percentile of page loads across mobile and desktop platforms.
Will Core Web Vitals Affect my Google Search Ratings?
Your score on Core Web Vitals will affect your search rating beginning 2021. Currently, pages are not being ranked using Core Web Vitals. Come 2021, Core Web Vitals will join security, mobile-friendliness, safety, and lack of popups as signals for measuring overall user page experience. Webmasters and owners have 6 months’ notice before Google starts using Core Web Vitals as a ranking signal. However, you can measure and improve on the metrics right now.
Tips to improve your Core Web Vitals score
Most of the common fixes for overall page speed will also be accompanied by the element of improving your page’s Core Web Vitals. According to Google, you could improve on your Core Web Vitals by:
Reducing the page size to less than 500 Kb
Limiting page resources to 50 for improvements in mobile performance
Using AMP to improve the page loading speed
Web.dev features tips for specific Core Web Vitals metric that is a great resource that every webmaster who works in SEO or Web development should use often:
You can also use the PageSpeed Insights testing tool to monitor the changes that you make. It is excellent in this because it allows you to validate Core Web Vitals changes from your report page. Long time PageSpeed Insights users may already be familiar with similar metrics, most of which will definitely stick around. Core Web Vitals is the culmination of these metrics and intends to come out of the Developer Experience complexity with them. Core Web Vitals are simple to cut through the noise and bring clarity among fewer and grander metrics to follow.
Lab vs. Field data
According to the conditions available, the scores can be wildly varying, literally changing as users navigate the pages. It is essential to know how each score is tabulated in a certain environment. However, you can only interpret the scores after determining whether the data was field or lab data. Core Web Vitals lab data is collected using the browser API as page load event timers and mathematical estimates that simulate user interactivity. While Core Web Vitals field data is made up of similar metrics, they are collected from real-life user experiences when navigating your web pages while the resulting event timer values are transmitted to a repository. Using PageSpeed Insights, Chrome Dev Tools, and the new Web Vitals Chrome browser extension, both developers and SEO practitioners have access to lab data in real-time. By counting up thread-blocking script times, PSI and WebPage Test generate your page interactivity scores from page load events. These lab data tools are invaluable to your workflow in reporting as well as improving Core Web Vitals scores, and should be among your SEO arsenal at all times. Unless you notice problems in field data, this lab data may also be all that you need as a developer if your website is powered by only a few templates. The Web Vitals JavaScript library can also be useful in your workflow if used as a testing pipeline. The library is available through CDN and can be included in HTML production and configured to transmit independently collected field data to the collation centers for reports. Lighthouse offers the webmaster various access points that are particularly useful in the development workflow. It includes several tests that help you ensure adherence to the set web standards. Lighthouse can also help you debug the situations in which you are troubleshooting problems relating to Core Web Vitals.
Comparing Field Data to Lab results
Chrome, Firefox, Safari, Opera mini, and other modern browsers measure how users in real-time experience your websites from their devices via built in JavaScript API. As noted, Google collects and reports its field data from Chrome users via it CrUX report using the same browser APIs at times. It is much easier to access actual field data when you have confirmed that your pages have field data in CrUX. This is done by verifying ownership of your website on the Google Search console. The Search Console’s dashboard displays field data on an interface that enables you to drill down using clicks instead of writing SQL queries. Alternatively, you could use PSI, which uses field data dating back up to 28 days. The API that drives the recency report is an independent open-source JavaScript library that can be brought into the development workflow, or used to control an app dashboard. PSI can also serve as a standalone app where a developer has already created a slick frontend for the app.
How to Troubleshoot Web Vitals Reporting
Due to the nature of some of the report timings and how data was collected, you will need to verify the lab data by correlating it to the field data and debug discrepancies. For instance, subsequent page loads may vary the result scores when monitoring Web Vitals using the Extension. There can be a couple of reasons behind this. The browser has the capability to bring together interactive values via the extension as you go through a page in a way that is similar to the real-world field data. By utilizing its own cache, your browser is also able to collect resources faster on refresh. To get the most accurate data and local results when optimizing for Core Web Vitals using the Chrome Dev Tools and Web Vitals Extension, remember to clear your cache or bypass it by pressing shift-refresh on the web browser in your workflow. Another brilliant tip is to load the ‘about blank’ page before beginning a performance monitoring and recording session in Dev Tools for a clean start to drafting a report. Field and lab data are typically very similar and with good reason. Whenever you make any significant changes on either, your lab results are going to be ahead of the field data or vice versa. Therefore, if you notice your tests are failing in the field and you have already improved the lab scores to pass, you need to either be patient enough for the field data to catch up with lab data, or push the field data independently via Analytics to verify it. While it might seem pretty obvious that CLS is the trickiest field data score to match locally, it is not necessarily the case. You could use the Chrome Extension to set the option to stick an overlay of Core Web Vitals then you can watch the scores changes as you navigate and interact with the page. The same works for FID. Your score becomes the first-page interaction (scroll, click, zoom or keyboard input) after the thread-blocking tasks have been added to the moment. The highly detailed information available in Chrome Dev Tools allows you to troubleshoot CLS to a miniature level with playback and performance recording. Click on the “Experience” section that outputs CLS shifts in the recording. You could also highlight shifts in the display using a setting that flashes elements blue when they shift and records them on the results.
Minor Web Vitals
While LCP, FID, and CLS are considered to be the CORE web vitals, there are a few other minor metrics that can be used to deliver a great user experience. They are popularly referred to as Minor web vitals or just web vitals.
Time to First Byte: TTFB is the time it takes the browser to receive the first byte of page content
Time to Interactive: TTI is the time that the page takes to load its sub-resources and be able to respond to the user’s commands.
Total Blocking Time: TBT deals with the time between FCP and TTI where there was a total block in the thread, preventing the page to respond to a user’s input.
Conclusion
Optimizing for Core Web Vitals is bound to be a big deal if you would like your pages ranking high on the SERPs in the coming year. Since the three Core Web Vitals are technical in their essence, there might be a lot of webmasters out there who are less knowledgeable in this particular aspect. However, there are plenty of developers and experienced technical SEO experts who will help you in this regard. We hope that we have given you a clear insight on Google Web Core Vitals.