Many marketers aren’t aware that there is actually a powerful reporting tool for marketers that is free and created by Google. It allows you to connect a plethora of data sources to compile in one nice and neat report. Google Data Studio can allow you to connect and build reports from data sources like Google Analytics, Google Search Console, YouTube, and a plethora of other sources that we will go over in the Data Sources section. In this guide, we are going to learn what Google Data Studio is, what it can do for you, and how to use it to create awesome reports.
What is Google Data Studio?
According to Google: Data Studio turns your data into informative, easy to read, easy to share, and fully customizable dashboards and reports. Use the drag and drop report editor to:
Tell your data story with charts, including line, bar, and pie charts, geo maps, area and bubble graphs, paginated data tables, pivot tables, and more.
Make your reports interactive with viewer filters and date range controls. The data control turns any report into a flexible template report that anyone can use to see their own data.
Include links and clickable images to create product catalogs, video libraries, and other hyperlinked content.
Annotate and brand your reports with text and images.
Apply styles and color themes that make your data stories works of data visualization art.
With Data Studio, you can build beautiful marketing reports for clients, employees, executives, and even yourself!
Google Data Studio Pricing
.A big question that many marketers ask is, “How much is Google Data Studio?”. It’s such a powerful tool that most marketers think that it costs money, but it’s actually comptelely free. Google offers Data Studio to marketers for no charge because it gets more people using their products like Google Analytics, Google Search Console, and YouTube. You can sign up for Google Data Studio for free here.
Google Data Studio Connectors
Currently, Google Data Studio features 24 Google Connectors and ~700 Partner Connectors. You can add any one of the below integrations to pull in and combine data from these sources. Here are the 17 Google Connectors you can use to pull data for reports:
Looker
Google Analytics
Google Ads
Google Sheets
BigQuery
AppSheet
File Upload
Amazon Redshift
Campaign Manager 360
Cloud Spanner
Cloud SQL
Display & Video 360
Extract Data
Google Ads manager 360
Google Cloud Storage
Google Surveys
Microsoft SQL Server
MySQL
NEW Search Ads 360
PostgreSQL
Search Ads 360
Search Console
YouTube Analytics
Tables by Area 120
We can’t list all of the integrations here as there are too many but here are some of the more popular partner data connectors:
Adroll
Adobe Analytics
Adstage
Amazon Ads
Amazon Seller
Asana
Bing Ads
CallRail
Constant Contact
Criteo
Salesforce
eBay Seller Central
Facebook Ads
Mailchimp
PayPal
QuickBooks
For the entire list of data sources view their list here. Some SEO platforms also have Looker Studio (previously Google Data Studio) integration. SE Ranking is one such platform, and the integration takes the reporting to a new level.Why do it? Because the two tools together will offer you deeper insights that any of them alone, all statistics is neatly visualized. You can create dashboards for different SEO performance metrics, including:
Paid and organic rankings
Search visibility
Traffic forecast, and more.
Besides, the list of available parameters is very generous. It includes but is not limited with: keywords, search engines, groups, tags, landing pages, SERP features, volume, KEI, CPC, competition and organic ranking.It’s also fairly easy to do it. Just find SE Ranking in Google Data Studio connectors and create a data source. After authorization via both accounts, you can choose the needed parameters for your project, then choose the data group you’ll need to show and all the required data about your project, and hit Connect. There you go!
Using Google Data Studio
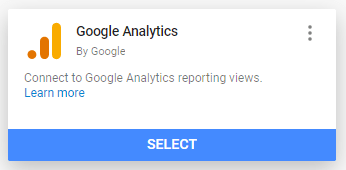
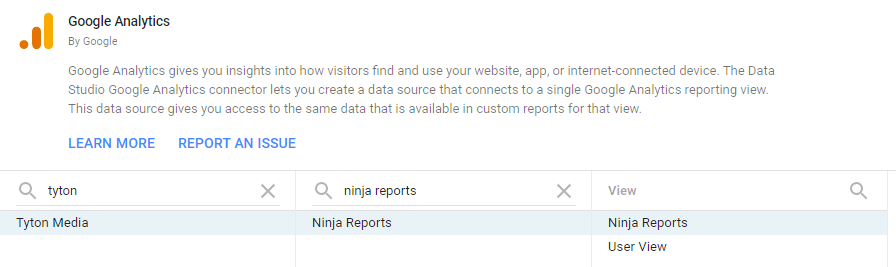
So now that you are familiar with what Google Data Studio is and what data you can connect to it, let’s do a walkthrough tutorial on how to set up a Google Data Studio Report. To make your first report, head to Google Data Studio and click the Create button. Choose Report to start a template from scratch. You will be directed to your blank report where we will need to add some data sources to pull data from. Let’s say we want to create an SEO Report to send to our clients. Click the ‘Create New Data Source’ in the right navigation pane. Choose the data source you want to add to the report. For our SEO Report, let’s add Google Analytics and Search Console. First, choose analytics to connect your Google Analytics account. Now choose which account you want to add to pull data from. Make sure its the correct Account, Property & View. Click connect and then confirm that you are adding this data to your report. Next, we will need to add our Google Search Console data from the same domain property so we can pull in that data and connect it to our report. To add another source, select Resource->Manage added data sources. Click add new data source like we did before and then select the Search Console connector to pull in all the data. Find your URL that corresponds to the property we connected to Google Analytics and then choose Site Impression and click Connect to connect Google Search Console. Confirm the connection and you have now connected two data sources to the report. Now, let’s start building our report with the data that we connected. First, give your report a name by clicking in the report name and choosing a descriptive report name. Now lets choose a theme for our report in the right window pane under the Theme & Layout options. You can also create your own theme/colors by selecting the ‘Customize’ button and adding your own color and layout settings. Now that the theme is set, we can start adding widgets for our SEO Report. All of the elements, graphs, and data that you can add can be found in the ‘Insert’ menu in the toolbar. Here are all of the elements you can add:
Time series
Bar chart
Combo chart
Pie chart
Table
Geo map
Scorecard
Scatter chart
Bullet chart
Area chart
Pivot table
Treemap
text
Image
Line
Rectangle
Circle
Let’ start by adding a simple time series that will show us the organic traffic from the chosen date range from Analytics. Choose Insert Time Series and then click where you want to add the module in your report. Once the module is on your report, you can click on the module to edit data sources, metrics, dimensions and even the style of the module. You can also see the available fields you can add to the module. Next, we need to update the module to only show organic pageviews. To do this, you will need to add a segment to only show traffic from organic visitors. Click the ‘Add a Segment’ link in the right pane of Google Data Studio. In the segment picker, look for the Organic Traffic segment and select it. Now your time series will only show pageviews from organic sources. Let’s add a title to the module so we know exactly what data is displaying. Use the square tool and the text tool to drag and drop a header above your module and add a descriptive header text so we know what data is being shown. Now apply the same method to build out other modules, graphs, charts, and tables. If you are not into building one from scratch, check out the templates below.
Google Data Studio Templates
Google provides a gallery of about 10 Google Data Studio Templates that you can start from including a few Analytics Reports, Adwords Reports, and YouTube Reports. If these templates won’t suffice, there are even more templates you can download below or in the gallery.
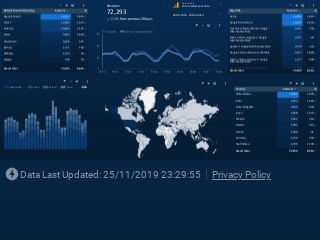
Overview of Google Analytics
An overview of your Google Analytics data on a widescreen one-page report. This Google Analytics report is perfect for a general overview of your Google Analytics. It shows cool maps, tables and bar charts that give an in-depth view of your traffic. Download template
Google Ads Monitoring Report
This super cool report template shows a treasure trove of data about your Google Ads Campaign. Download template
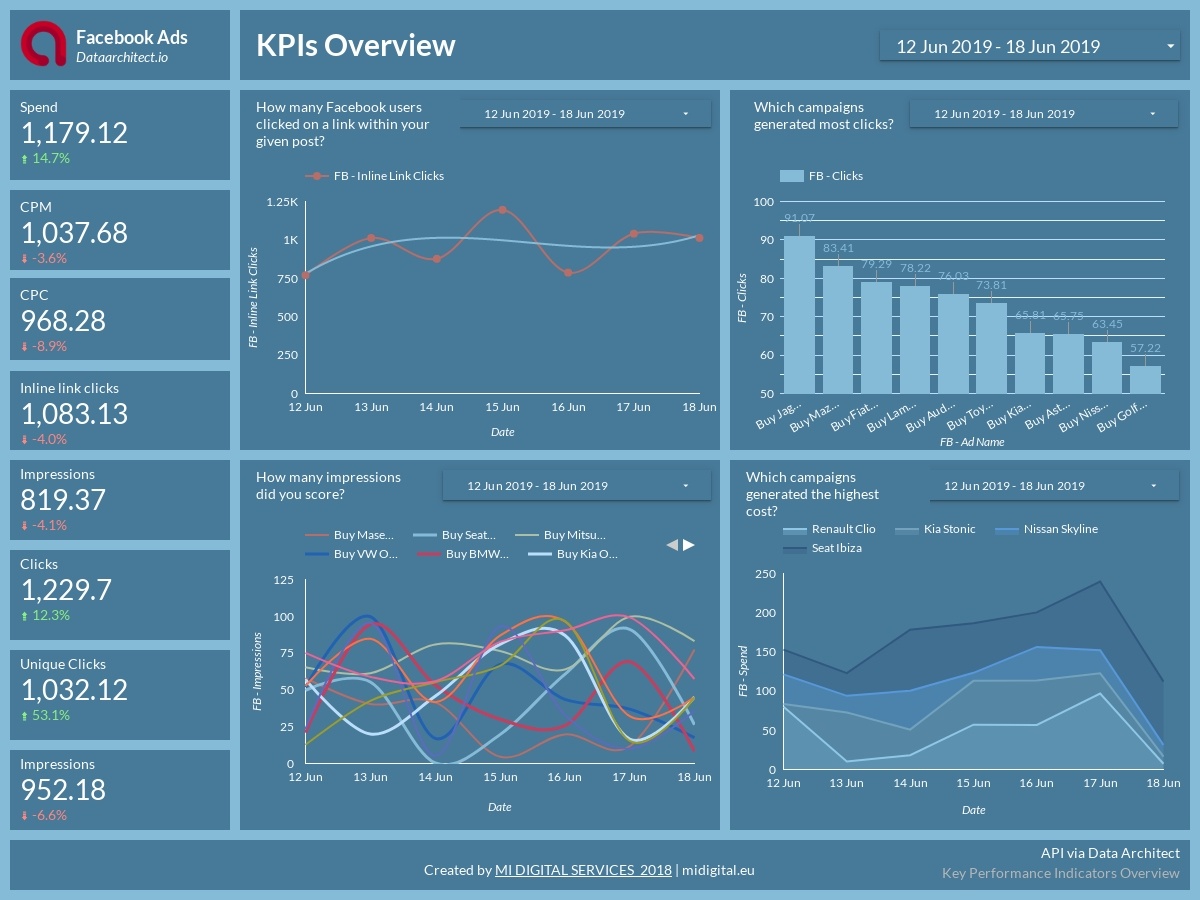
Facebook Ads KPIs overview
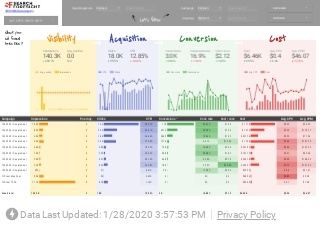
If you are a Facebook Ad Agency and you want to create an amazing report for your clients, then check out this template by M Digital Services. It features spend, CPM, CPC, Impressions and a number of other KPIs to keep a close eye on clients’ success. Download template Website & Marketing Performance Report This amazing marketing report by Aro Digital features a general overview of all marketing aspects of your campaign. You can view site health, sessions, revenue, and even conversion rates. This Data Studio report template is perfect for e-commerce sites, or SaaS’s generating revenue online. Download template
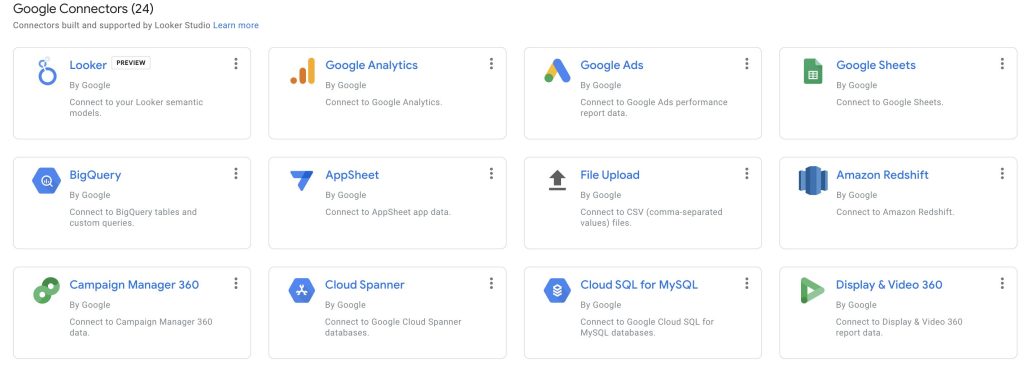 Here are the 17 Google Connectors you can use to pull data for reports:
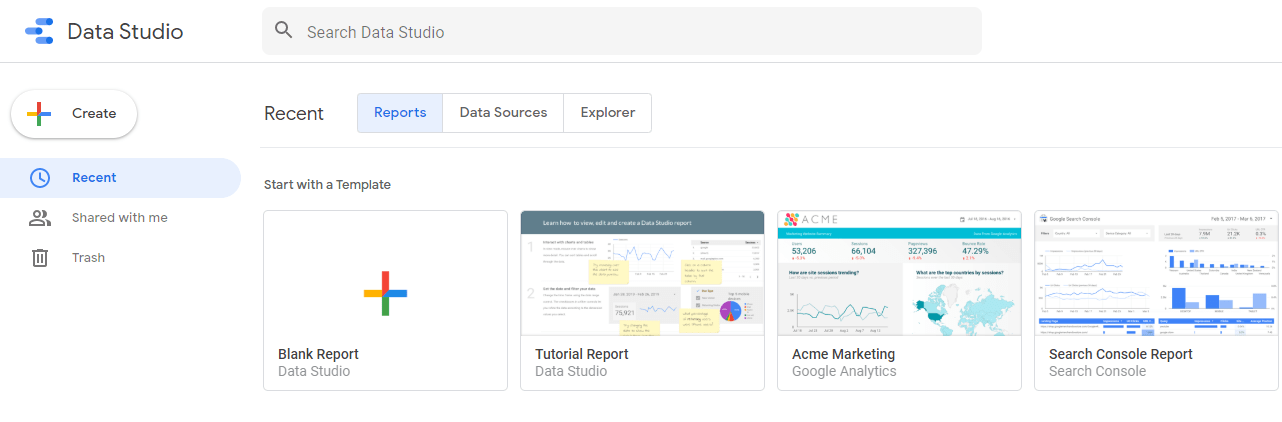
 Click connect and then confirm that you are adding this data to your report.
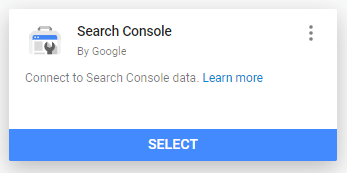
  Next, we will need to add our Google Search Console data from the same domain property so we can pull in that data and connect it to our report. To add another source, select Resource->Manage added data sources.
 Find your URL that corresponds to the property we connected to Google Analytics and then choose Site Impression and click Connect to connect Google Search Console.
 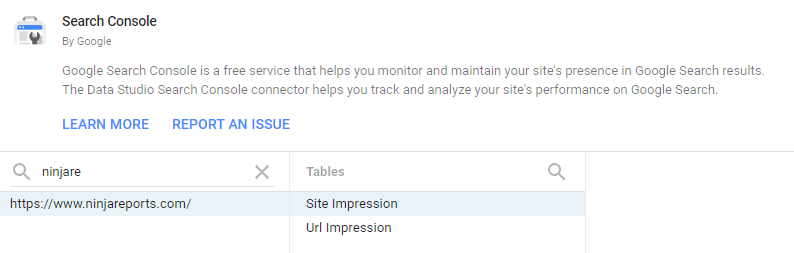 Confirm the connection and you have now connected two data sources to the report. Now, let’s start building our report with the data that we connected. First, give your report a name by clicking in the report name and choosing a descriptive report name.
 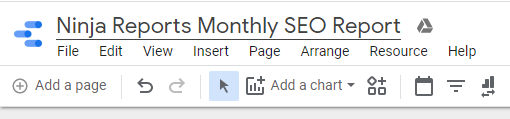 Now lets choose a theme for our report in the right window pane under the Theme & Layout options.
 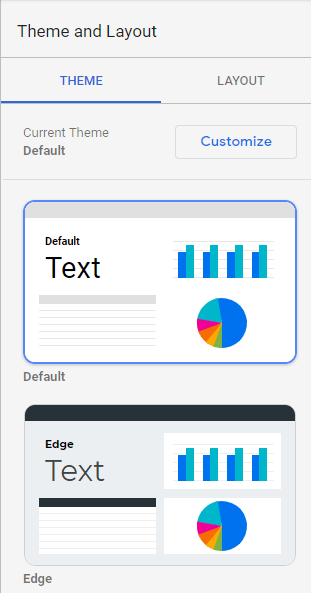 You can also create your own theme/colors by selecting the ‘Customize’ button and adding your own color and layout settings. Now that the theme is set, we can start adding widgets for our SEO Report. All of the elements, graphs, and data that you can add can be found in the ‘Insert’ menu in the toolbar. Here are all of the elements you can add:
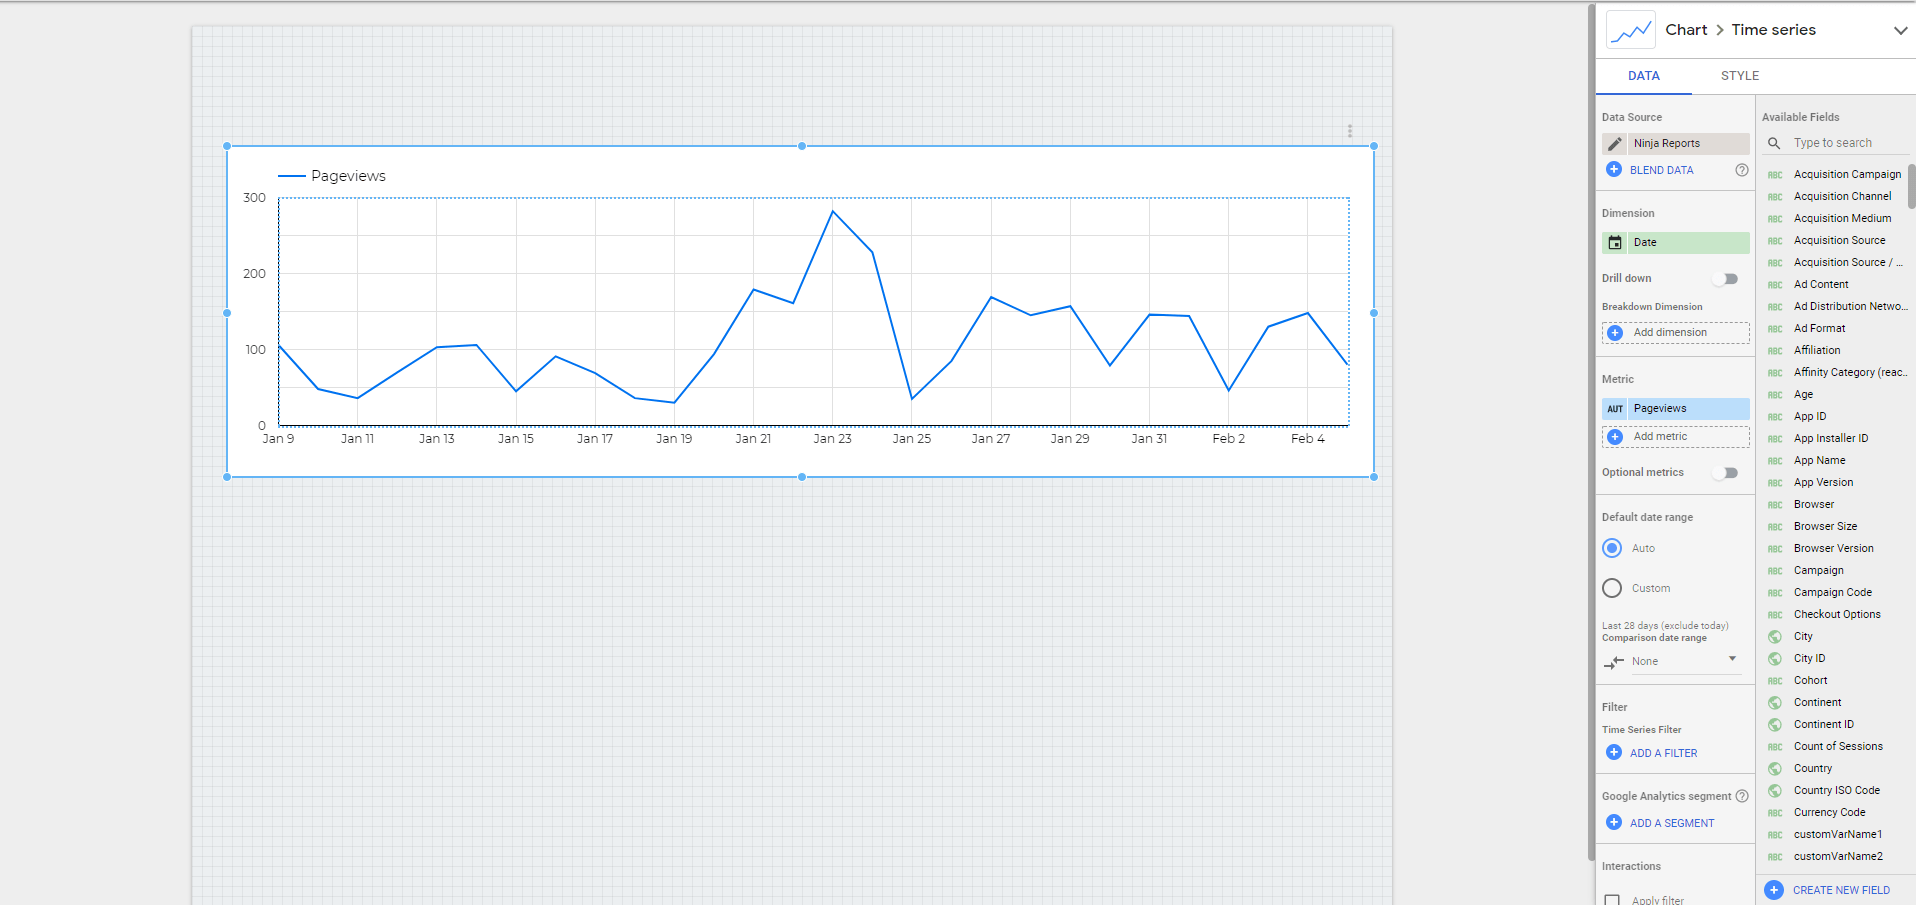
 In the segment picker, look for the Organic Traffic segment and select it.
 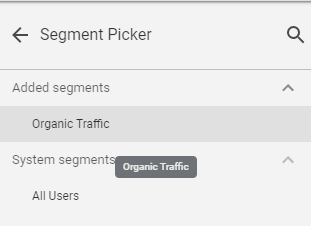 Now your time series will only show pageviews from organic sources. Let’s add a title to the module so we know exactly what data is displaying. Use the square tool and the text tool to drag and drop a header above your module and add a descriptive header text so we know what data is being shown.
 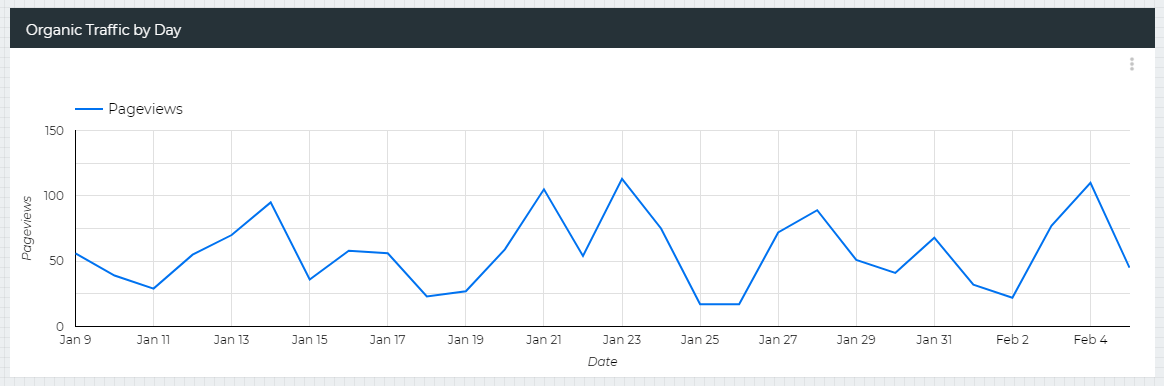 Now apply the same method to build out other modules, graphs, charts, and tables. If you are not into building one from scratch, check out the templates below.