Custom Google Analytics reports can show you several things about your website or business that can help increase your overall ROI and website usability. Some of the biggest online marketers in the world have created custom Google Analytics reports and you can use them yourself… for free! In the Google Analytics Solution Gallery, you can find thousands of custom Google Analytics reports and Dashboards that will help you see data you never knew you had before. Some of the biggest marketers share their reports here and you can import them right into your Analytics dashboard. In this article, I am going to show you some of the most important custom Google Analytics reports that you should be using.
Flexible Solution
SE Ranking SEO Report Tool with Integrated GA Reports
Why limit yourself to data from one tool? SE Ranking has Google Analytics integration that helps you see a clearer picture of your website traffic, SEO performance, and audience behavior. In addition to GA statistics on traffic, pages, conversions, goals, and more, you get full access to your website’s search performance and SEO analytics data.
Review the dynamics using the two most powerful tools at once and build reports whenever you need them. In addition, SE Ranking gives you outstanding flexibility in work: adjust your reports with flexible customization and white-label functionality, use predefined templates or create your own, automatically schedule and send reports, or conduct them manually – the tool covers everything you may need. Get a free trial to access the tool’s advantages.
Free Trial
Site Optimization
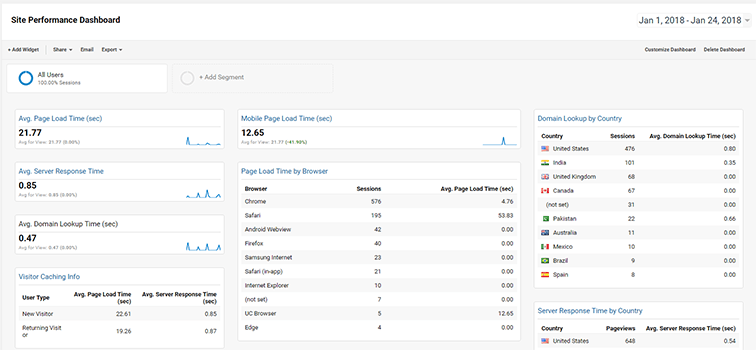
Site Performance Report
Having a fast-loading website is a huge factor in SEO and keeping visitors on your site. You can keep a close eye on your site’s performance with the site performance dashboard report. It’s a great dashboard to see load times by country, device, pages, and even server response times. If you want to save money on tools like New Relic and other server monitoring tools, you can install this free site performance report in Google Analytics.
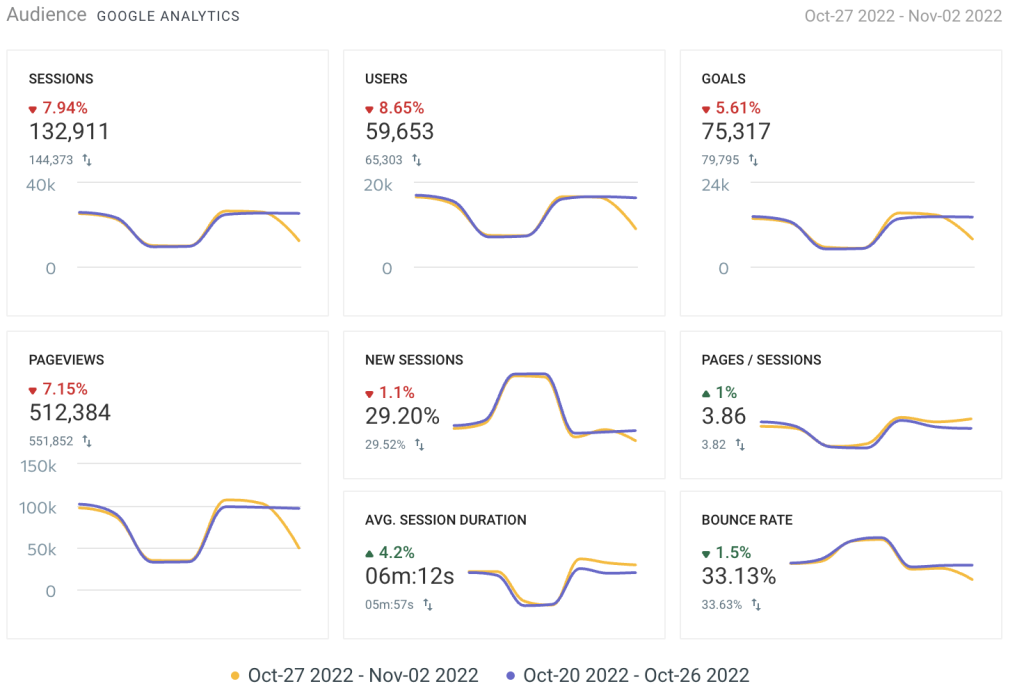
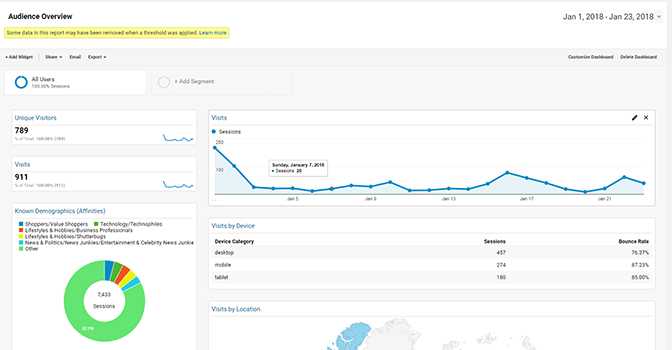
Audience Snapshot Report
This dashboard will show you a top-level overview of your website visitors like where they are located, what device they are visiting from, and how engaged they are. This custom Analytics report was created by Loves Data and has been used almost 30,000 times.
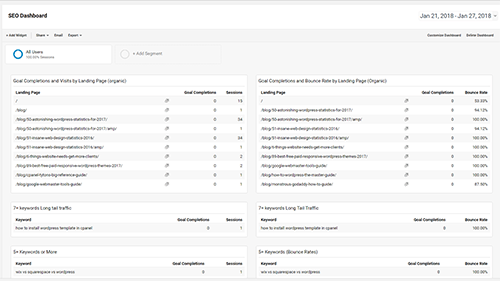
SEO Dashboard
The SEO Dashboard report by Kevin Pike has been used over 80,000 times and will show you top landing pages by completions, bounce rates, and long tail keywords with conversion rates. If you are generating SEO reports for your clients or you want to see the results of your SEO campaign, the SEO Dashboard is the perfect custom report.
Conversions
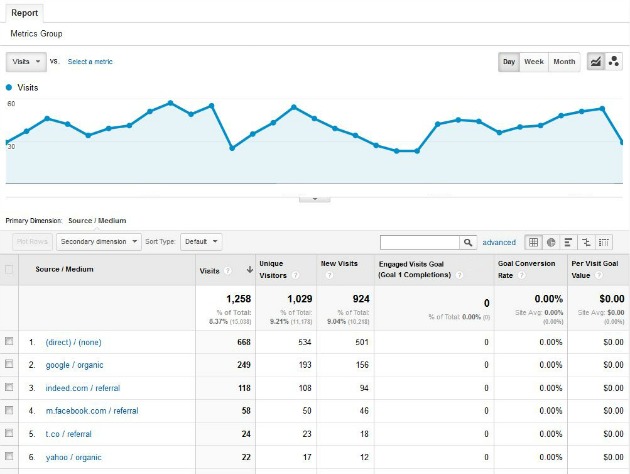
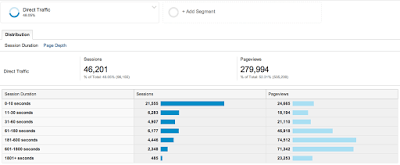
Visit and Goal Conversion by Traffic Source
With this report, you can see how your best customers are getting to your site. It shows the top visits and conversions by traffic source. If you have conversions set up on your website then this report is vital to figuring out your target traffic source and seeing where your biggest customers come from.
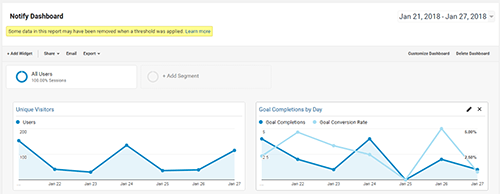
Goals and Channels Dashboard
Conversions are the most important part of your business. Conversions equal revenue which you want to track as much as possible. With the Goals and Channels report, you can see goal completions by channel, location, age, and other great dimensions. The Goals and Channels dashboard report was created by Paul Fervoy and has almost a 5-star rating. With this report, you can schedule it to be sent weekly via email to your manager or clients.
Acquisition
New Google Analytics User Starter Bundle
If you are new to Google Analytics then the New Google Analytics User Starter Bundle is a perfect report to start with. It’s a bundle of must-have dashboards, segments, and custom reports for any new Google Analytics user. View Acquisition efficiency, mobile metrics, referring pages, and more. This Google Analytics Custom Report was created by the Google Analytics Team and is currently being used over 235,000 times.
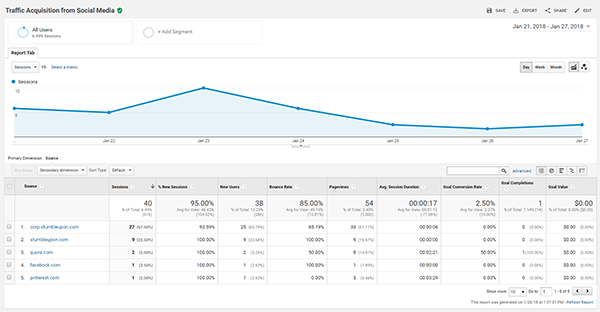
Traffic Acquisition from Social Media
Traffic Acquisition from Social Media Analytics report is perfect for any Social Media Agencies or brands that focus on social media. It will show you traffic that comes from all types of social media, goals from social media, and all sorts of great data about your social sources. This report was created by Vagellis Varfis from Vagelis Varfis at Nudge Digital.
Display Advertising
AdWords Performance Snapshot
This report dashboard is a necessity for anyone doing digital advertising using Google Adwords. Created by Loves Data, this custom report has over 25,000 downloads and a 4-star rating. The custom report will show you the performance of your Google Adwords campaigns including, keywords, ad groups, and other vital metrics from Google Adwords. Use this report to optimize your Adwords campaigns by viewing the highest-converting ad groups, keywords, and campaigns.
[Engagement Pack] Core Remarketing Lists
If you run any sort of re-marketing campaigns for your business or your clients, then you should try this core remarketing list created by Dan Stone on the Google Analytics Team. This core set of 20 lists is based on user engagement and allows you to re-engage with your users differently based on frequency, recency, and visit duration. Note: RLSA will automatically adjust membership duration to be a maximum of 180 days (vs. 540 days available on Display), so if you are using these lists for RLSA, the 360 and 540-day lists will be identical to the 180-day list when used in Search.
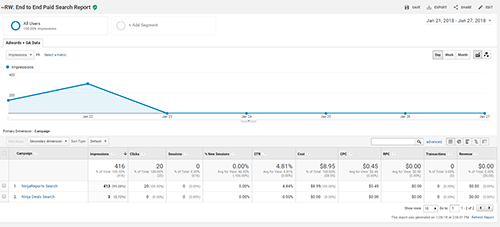
End to End Paid Search Report
This custom report by Rachael W on the Google Analytics team is an end-to-end report to see all of your user outcome metrics, behavior, and acquisition, all in one simple report. It will combine paid search from all your paid search sources whether it’s Google Adwords, Facebook Ads, or any other paid traffic source. You can view impressions, visits, clicks, Cost, CTR, CPC, Revenue, RPC, Transactions, and more.
Mobile
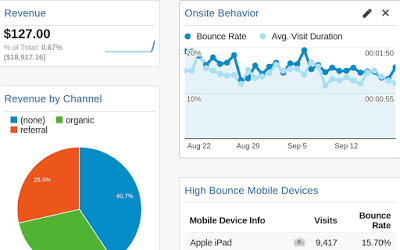
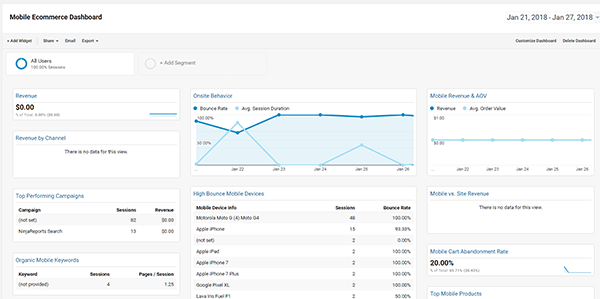
Mobile Ecommerce Dashboard
The Mobile E-commerce Dashboard is a report created specifically for measuring mobile activity on your e-commerce website. Focusing on revenue from mobile, you can view several great metrics like top performance campaigns and mobile bounce rates. You can view which devices have the highest bounce rates so you can fix any device-specific design issues. If you run an e-commerce website that gets any mobile traffic, you should try this report out.
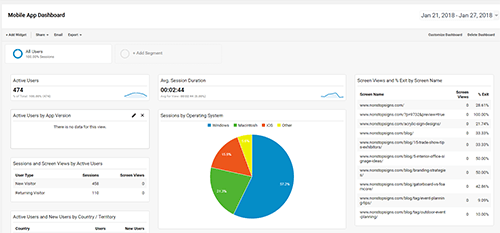
Mobile App Dashboard
The mobile app dashboard was created for people who have Google Analytics installed on their Mobile App. If you are not tracking analytics in your mobile app, then you should install it right now and use this dashboard. It focuses on visitor acquisition, engagement, and outcome perspectives for your mobile App.
Organic Search
SEO Dashboard – Finding Top Content and Keywords
When you run SEO campaigns for clients, you must keep a close eye on the performance of the campaign. With the SEO Dashboard, you can see all the best-converting pages from your pages as well as long tail keyword traffic and a breakdown of all your best keywords by visits, bounce rates, and conversions. To keep a close eye on your SEO, try the SEO dashboard by Kevin Pike.
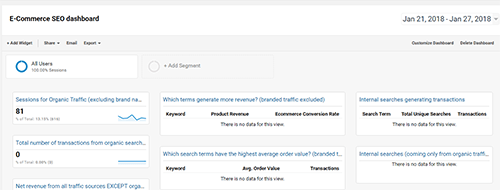
E-Commerce SEO Dashboard
When you run an e-commerce site, SEO is one of the most important metrics to look at because it’s one of the best ROIs for your money. With the e-commerce dashboard by Nudge Media, you can see an in-depth analysis of your SEO efforts to see if your non-branded organic traffic generates higher revenue orders.
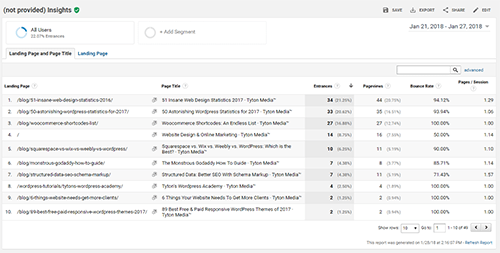
SEO Insights for Google Organic
The SEO Insights report will show you landing pages listed by most entrances, pageviews, and bounce rates. View which of your landing pages are generating the best SEO return. Get an in-depth look at your pages/sessions and bounce rates for your most important landing pages.
Social
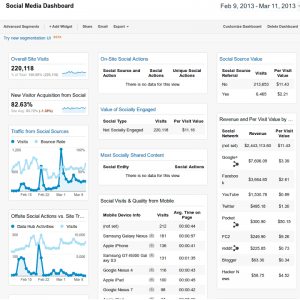
Social Media Dashboard
Social media reports are really important for growing your brand online. With the Social Media dashboard report, you can see how your social media profiles are performing. With this dashboard, you can view off-site activity, on-site activity, conversions from social media, and revenue as well.
Social Engagement Report
This report by Rachelle Maisner is a 4 tab report that shows you social media engagements on your website. You can see top shared content, conversions, and socially engaged visitors.