 If you run a PPC (pay-per-click) or digital advertising agency, then you know that updating your clients on the progress and performance of their campaigns is vital. However, manually sending reports to clients every day is not a good way to scale your digital advertising agency. Automating your Google Adwords reports for clients can save your agency hours while also adding more value to your agency by offering automated reports of campaign performance or progress. In this article, I am going to show you some great tools you can use to automate Google Adwords reports for clients.
SE Ranking
By using SE Ranking SEO Report Generator Tool, you save lots of time and effort when it comes to compiling paid campaign data in reports and sharing them with your team and clients. The tool has several neat templates focused on various analysis spheres, including a pre-set Google Ads template. Just make sure that your Google Analytics account is authenticated with your project on the SE Ranking platform. Then, just click on the corresponding report template or create your own, set up the date range, and download your report in a format that is convenient to you. 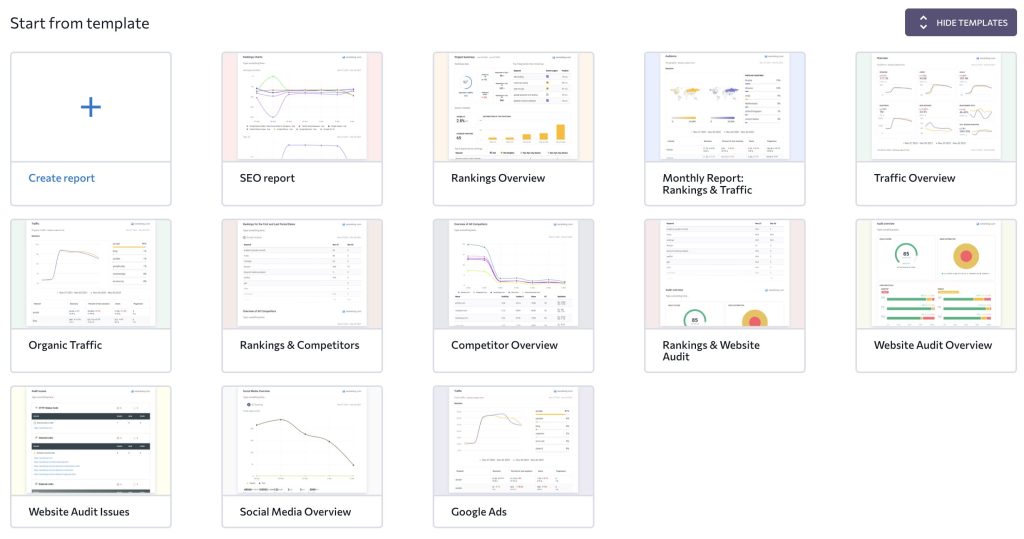 You can customize any report by adding more data, your notes or by using the white label feature to create personalized reports for your customers. The Report Generator Tool by SE Ranking offers manual and automatic reporting. The latter can be scheduled beforehand with any convenient frequency and time. Create worry-free reports on the paid and organic performance of your or your customers’ websites, their traffic, SERP results, brand reputation on social media, and more – everything at a single place.
Google Adwords Reports
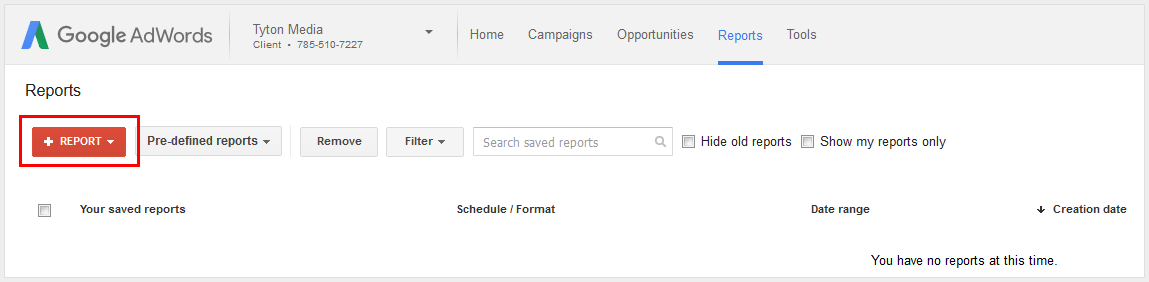
You may not have known this but you can send automated reports to your clients inside Google Adwords. Their interface is a little more confusing and advanced but if you are a Google Adwords whiz, you can create super-detailed automated reports to send to your clients. To create reports in Google Adwords, just click the Reports link at the top of the main menu.
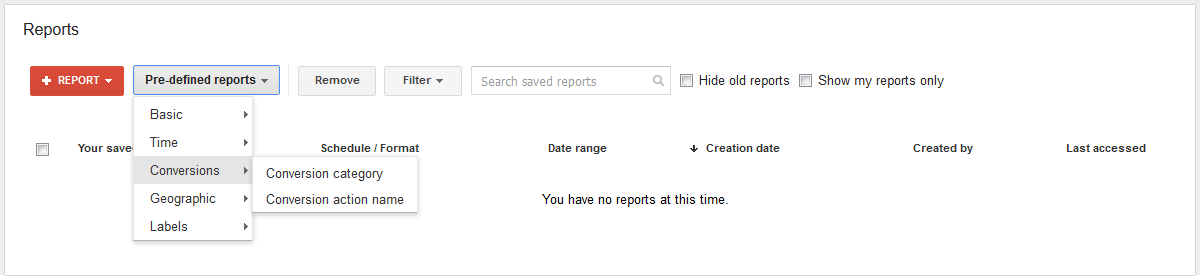
You will see a list of all your reports on the Reports tab. If you don’t have any reports, you will see a message that says, “You have no reports at this time”. To create an Adwords report from a template then click the Pre-defined reports button. Here, you can choose from a large list of pre-made reports by Google.
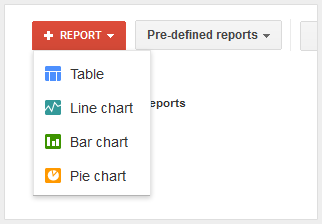
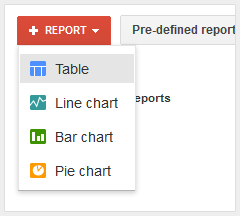
To create a new custom report, click on the bright red report button and you will see a dropdown to choose which type of report you want to create.
You can choose from:
- Table
- Line Chart
- Bar Chart
- Pie Chart
Don’t worry too much about which one to choose because you can switch it once the report is created. I just chose line chart to keep it simple to start. You will be directed to a page I like to call the report center. This is where you can visually build your Adwords reports.
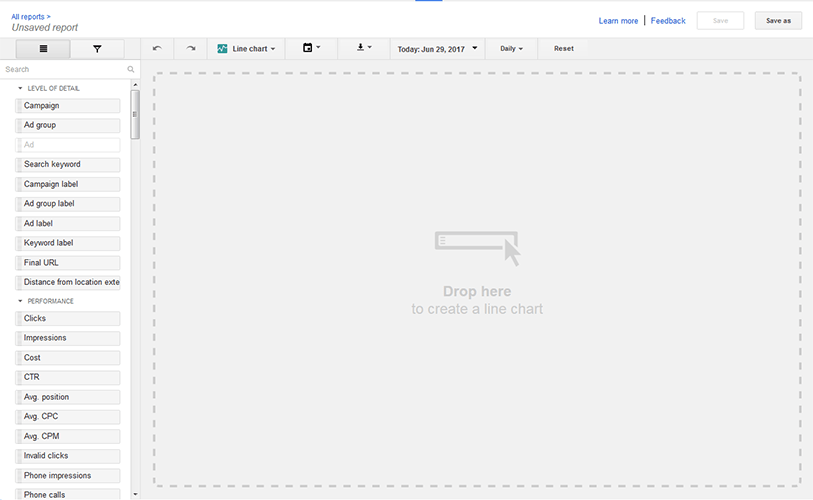
On the left, you have all of your metrics and data points that you can drag to the right and build reports. The main sections for the data points are.
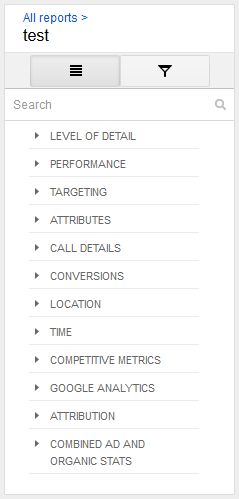
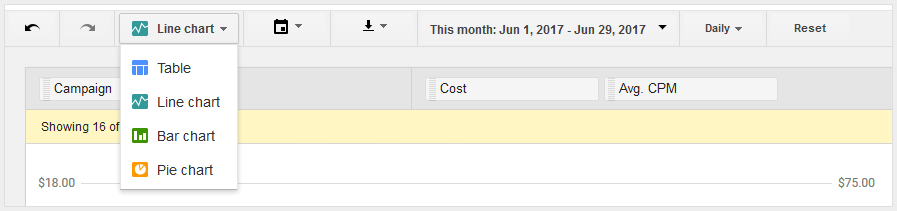
Simply drag metrics from the level to the graph area on the right and build almost any report you can think of! At the top of the report center, there are a few buttons, filters, and options that can help you build even better reports. If you want to change the type of report, click the graph type select list, and choose which graph type you want to change it to.
The next button allows you to set up automated Adwords Email Reports and send to specific account users. Choose the format of the report, who to send it to and the frequency. If you are looking to send more detailed email reports to multiple recipients then check out our Google Adwords Automated Email Reports.
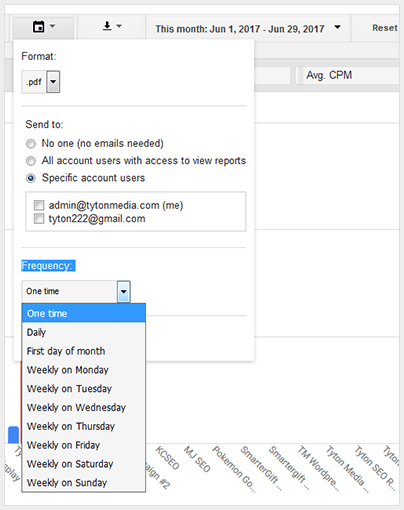
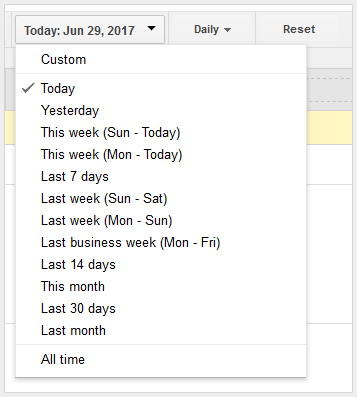
The next button allows you to simply download the current report once. To change the date range of your report, select the date and choose a custom date range or one of the pre-defined ranges.
When you are ready to save your Adwords report, click the save button in the top right corner of the interface. A popup will appear where you can type in a name to save your report as.
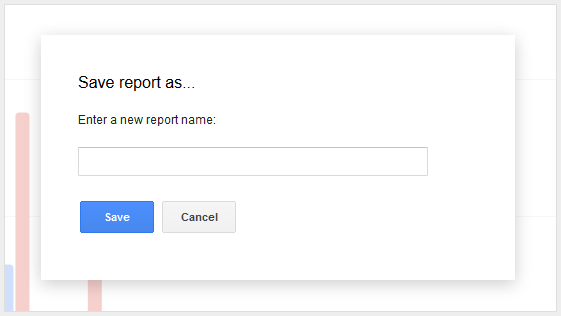
Enter a name that describes the report well and click the blue save button to save the report.
Example Google Adwords Report Templates
Google Adwords Search Term Report
To create a search term report in Google Adwords, start by creating a new table report.
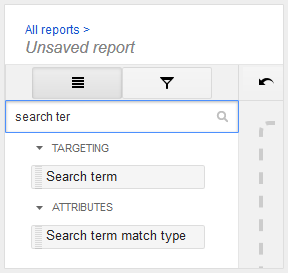
Search for ‘search term’ in the left sidebar and find the search term label. Drag this over to the right and you will see a list if search terms your ads got impressions or clicks for.
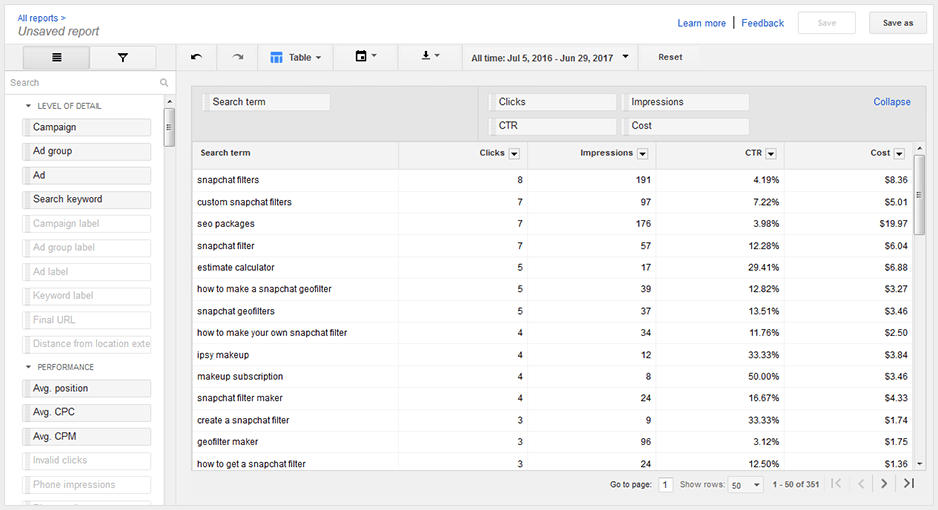
You can now add other metrics to compare against these search terms… like Clicks, Impressions, and costs. Here is an example report we built that shows your search terms and some vital data for each one:
To make your work even more convenient, SE Ranking SEO Report Tool offers Google Analytics integration so you can get a bird-eye view of your paid and organic campaigns, as well as other metrics, everything at the same place. Sounds good, doesn’t it? The reports SE Ranking offers are highly customizable, so any business can build its report structure suitable to its brand and goals. Any report can be white-labeled and scheduled beforehand with an automatic sending to your or your client’s email. SE Ranking has a lot of advantages, making it one of the best integration opportunities for GA. First of all, it’s more intuitive. All data is structured so well that it is easy to comprehend even for a beginner. Besides, you can keep all your projects in one place, which is much more convenient and time-saving than downloading several reports from different platforms.
Google Analytics Reports
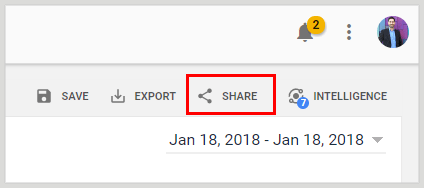
If you have Google Analytics and Google Adwords connected, then you can also send automated reports to clients using Google Analytics. When you connect your Adwords, you can see pretty much all the data in Analytics, which I’m sure you know, you can create automated email reports in. To create automated Adwords reports in analytics just go to an Adwords-based report like Paid Keywords Report or any of the Adwords tab reports. Once you see the data you want to send to your clients, click the share button at the top of the Google Analytics page.
From there you can add as many emails as you want, choose a custom subject line, add attachments and set the frequency of the reports. If you want to add a custom message to the reports you can do that as well.
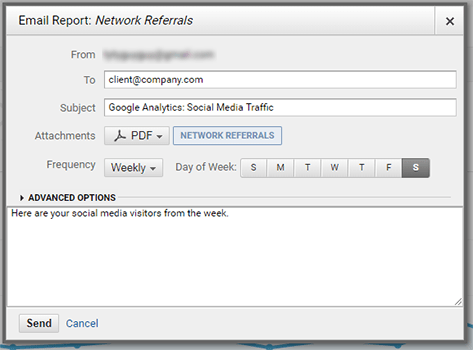
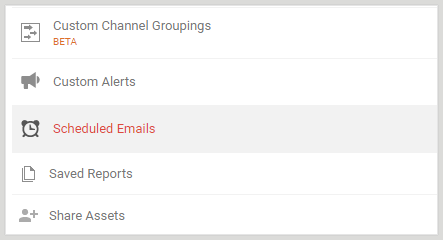
Once, you are finished, click the send button and your report will now be scheduled to be sent at the requested time. To remove or edit reports go to Admin->View->Scheduled Emails and you can view a list of all your scheduled email reports.
Metrics Watch
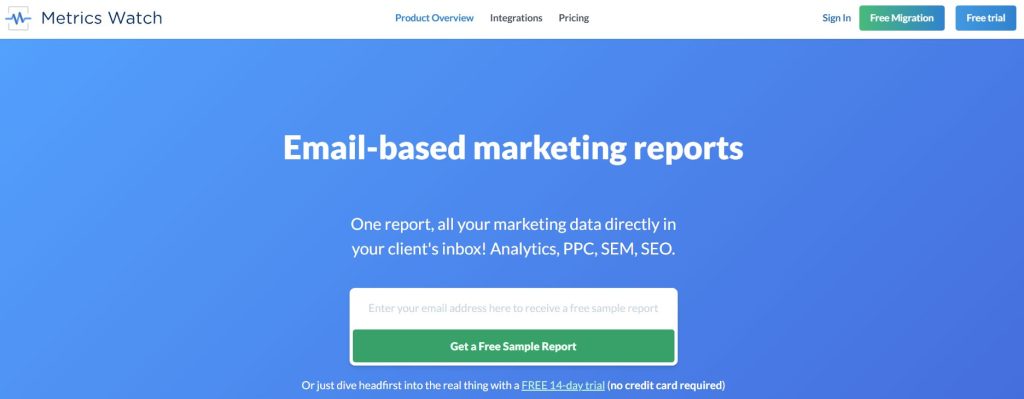
Do you want to create informative Adwords reports for clients without the skills and experience of a professional analyst? This platform allows you to build reports in a visual drag-n-drop editor. No need to select metrics from huge lists and write dozens of lines of code. Just select the desired item and drag it to the screen. Simple, convenient, and fast.
In addition to Google Adwords, you can connect other marketing programs to the reporting software. This allows you to collect all available information in one report. You can demonstrate how your contextual advertising affects your overall financial results, logistics costs, customer lifetime value, or other KPIs.
Another advantage of such Google Adwords reports for clients is that they are embedded directly into the HTML code of an email. Forget about links to dashboards, logins and passwords, attachments, and other sources of digital clutter. Your customers will only need one click to view all the metrics and get the data they need to make management decisions.
Whatagraph
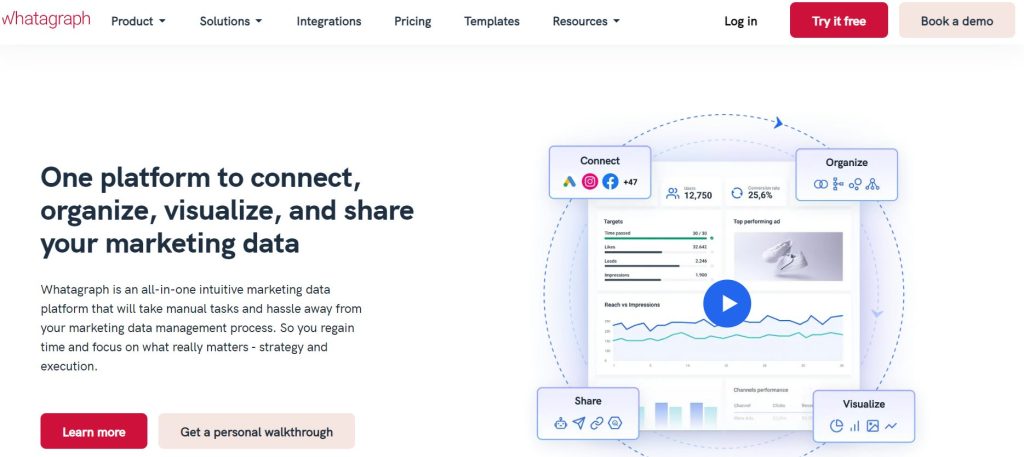
It is a powerful Google Ads reporting software for real professionals. The platform offers more than 100 ready-made templates, each of which can be customized by changing data fields, the order of tables and charts, as well as visual design elements. Coupled with the white-labeling capabilities, it’s the perfect service for marketing agencies.
The advantage of Google Ads automated reports is the ability to download data from various channels — more than 40 sources of information are supported. The program also provides tools for flexible customization of the frequency of newsletters. If you want to send data every second Thursday of the month, you can do it!
There are a few disadvantages of this Adwords reporting software, but you should take into account the high price. The minimum price of $199 per month will be more relevant for large agencies than for individual specialists and small but very ambitious startups.
AgencyAnalytics
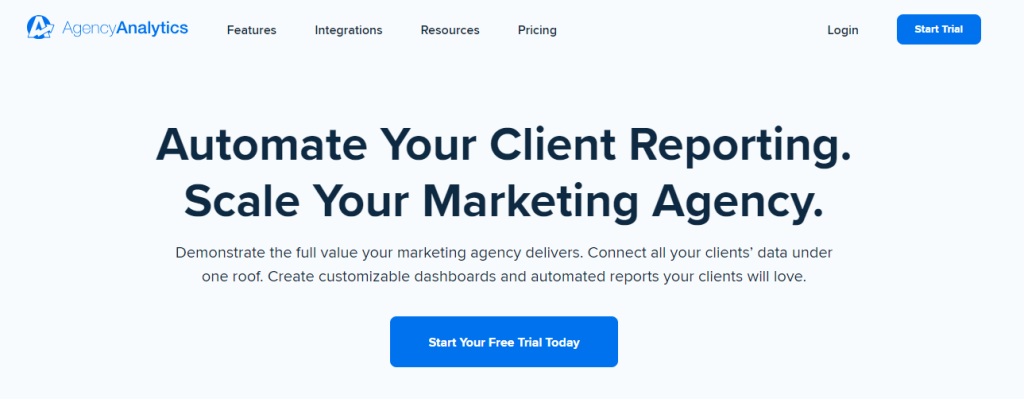
The developers of this platform decided to be as honest as possible. The main goal of business is profit. Therefore, in Adwords reports for clients generated by AgencyAnalytics, everything revolves around the return on investment (ROI). This approach provides significant advantages — it allows you to track the connection between each element and financial results. Did you change one word in your message to potential customers? Thanks to AgencyAnalytics, you can see what was the effect in USD.
Few people will be surprised by the possibility of automating Adwords reporting and creating a white-label newsletter. A convenient visual reporting editor is also available on many marketing platforms. The key difference between AgencyAnalytics is the notes and comments feature. You can add hidden messages that will pop up when you hover over them. This allows you to explain Google Ads reports for clients clearly. On the other hand, the dashboard is available only through a link and opens after logging in. Each client decides for themselves how convenient it is.
However, it is rather worth it. Interesting animated widgets demonstrate the relationships between individual marketing metrics. Even if this is your first time using such reporting, you’re unlikely to have any difficulty understanding them.
Databox
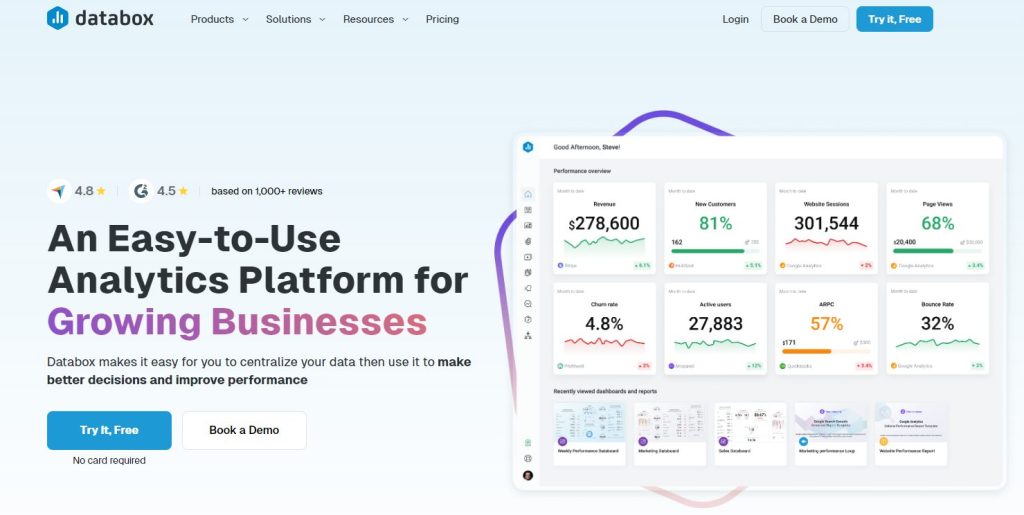
Databox is a comprehensive analytics platform that comes with ready-made Google Adwords reporting templates. They cover several key metrics: ROI, competition by keyword, cost per click, minimum and maximum bids, etc. If necessary, you can build your own reports from scratch, although this will require some math skills.
The advantage of Databox is that you get not only Google Ads reports for clients but also your own “early warning system.” If your marketing campaigns deviate from the plans at some stage, you will be instantly notified. The platform also allows you to make notes on reports, both for clients and for internal use. This is useful when delegating responsibilities or training beginners. Another great news is that a standard Adwords report for the client can be built in a free version. If you’re ready to limit the data set and give up branding, you don’t have to choose an expensive subscription plan.
Adstage
If you are looking for closed-loop online reporting, then Adstage will blow your mind. Adstage allows you to connect ad spending to conversion data and see which paid channels (like Adwords) are working the best. They also offer reporting for Adwords and several other paid advertising networks. 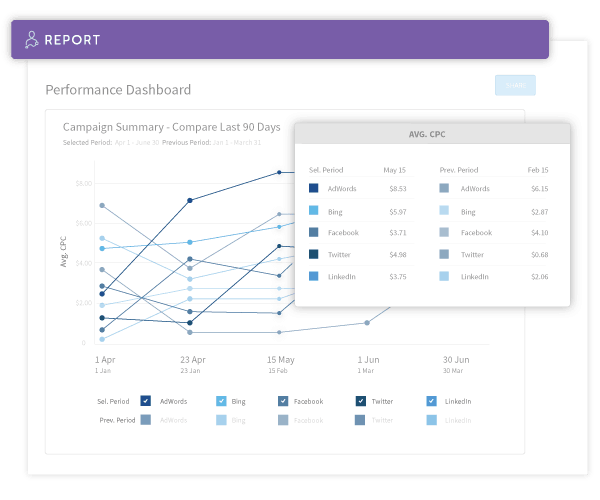
With Adstage, you can connect and import all of your data and bind it together into super reports that your customers/clients can log in to a special URL and see. If you want to measure the performance of your client’s Adwords campaigns then Adstage is a good option. Not only can you automate reporting with Adstage, but you can also let it automate your Google Adwords optimization. Create conditions and rules that will trigger whenever you need, 24/7, 365.
DashThis
If you want your clients to have a 24/7 look at their Google Adwords campaigns, you can sign up for DashThis and create an Adwords Dashboard with all the most important KPIs. It’s perfect for agencies as you can add your agency’s logo, drag, and drop widgets to create a dashboard, and then share it with your clients.
With DashThis, you can keep a constant eye on your client’s Adwords reports with up-to-date data about campaign performance and ROI. Your clients will love being able to see their campaign performance in real time.
Zoho Reports
Zoho Reports can help automate your Google Adwords reports by providing clients with a real-time dashboard and up-to-date analytics of your Google Adwords campaigns. With Zoho Reports, you can create visually insightful reports and dashboards with a drag-and-drop interface. They provide a variety of reporting components, KPIs, pivot tables and even data blending. So you can measure the performance and ROI of your client’s reports.
You can even invite your clients to view your reports, collaborate, and analyze this important data. Reports can be embedded almost anywhere and you can even print them for clients. If you like the spreadsheet type of interface, then you will love Zoho Reports for automating client reports.
Wrapping Up
In conclusion, there are several great tools out there that allow you to free up your time by automating your Google Adwords reports for clients. If your agency is growing fast and the burden of updating your customers on their campaign keeps you up at night, then you should start using some of these tools. Whether you want to send automated Google Adwords email reports or create an awesome dashboard for your client, there are plenty of great tools to choose from.